



Contents:
When I stepped into the role of CEO at Panintelligence, I gained full oversight of every function — including Sales and Marketing. One of the first things I noticed was something many high-growth businesses grapple with: fragmented, disconnected sales data.
Despite being a data analytics company, we weren’t immune. Like many, we’d invested in the right tools — Salesforce, ZoomInfo, Salesfinity, LinkedIn Ads — but our data was scattered. Zapier kept things loosely connected, but strategic insight remained elusive, buried in spreadsheets or siloed systems.
So we did what we encourage our customers to do — we turned the lens inward. We started drinking our own champagne and used Panintelligence to bring clarity, cohesion, and control to our own revenue operations.
The Challenge: Data Everywhere, Insight Nowhere
Revenue leaders need timely insights to make confident decisions. But our teams were spending valuable hours assembling reports, reconciling sources, and reacting too slowly to what the data was trying to say.
We knew it wasn’t sustainable. We needed a unified view — one version of the truth — that would bring Sales, Marketing, and Leadership onto the same page. Enter our own platform: Panintelligence.
The Solution: Building Our Own RevOps Command Centre
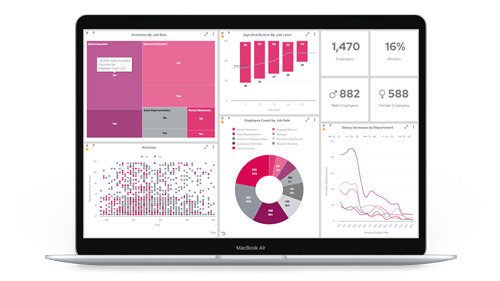
We used Panintelligence to connect and visualise data from Salesforce, Salesfinity, LinkedIn Ads, ZoomInfo and more — building out a RevOps Dashboard that shows the entire revenue engine in real time.
Use Case 1: Call Logging & Connection Rates
Our Salesfinity outreach data now feeds into a dashboard that tracks:
- Call and email volumes
- Connection-to-meeting conversion rates
- Performance by rep, day of week, and messaging type
Benefit: Enables better planning and resource allocation, helping SDRs prioritise time and optimise outreach strategies.
Use Case 2: Pipeline Velocity & Deal Health
By surfacing Salesforce data in Panintelligence, we now track:
- Deal progression across stages
- Average time-in-stage and conversion trends
- Forecasting accuracy and risk indicators
Benefit: Provides sales leaders with real-time visibility into stuck deals, improving pipeline hygiene and forecast confidence.
Use Case 3: Marketing Attribution & Campaign ROI
By linking LinkedIn Ads and CRM data, we’ve built dashboards to show:
- Cost per lead (CPL) and campaign performance
- MQL to SQL conversion rates
- Attribution across key touchpoints
Benefit: Helps marketing teams make data-led decisions, reduce spend on low-performing channels, and improve ROI tracking across the funnel.
The ROI: Visibility, Alignment, and Agility
Drinking our own champagne has delivered benefits that go well beyond time-saving:
- Improved visibility: A single, trusted view across all sales and marketing activities
- Better alignment: Everyone works from the same data, driving consistency and collaboration
- Faster action: Trends and issues are surfaced in real time, enabling rapid course correction
- Greater confidence: Leadership can make strategic decisions based on evidence, not anecdote
Final Thought: We Are Our Own Best Test Case
As CEO, I take pride in the fact that we don’t just build Panintelligence — we rely on it every day. Using our own platform has helped us untangle the complexity in our revenue operations and operate with greater clarity and confidence.
If your sales and marketing data is fragmented, your team is flying blind, or reporting is eating up valuable time — we’ve been there. And we’d be happy to show you how we’re solving it.
After all, we’re not just selling the champagne. We’re drinking it too.