


When OpenAI launched GPT-5, it should have been a milestone in AI innovation. Instead, within a day, users were asking for the old GPT-4o back. The “real-time router”, a feature designed to decide when the AI should think deeply versus respond quickly, often made the wrong call. The result was a model that felt less capable, not more advanced.
Then came the moment that really caught my attention: the chart crime. In the launch demo, GPT-5 produced bar charts where higher values appeared with shorter bars, and identical bars represented wildly different numbers. This was not an AI hallucination, it was human oversight under pressure. But the damage was the same: a visual that looked right, but was not. Trust evaporated in seconds.
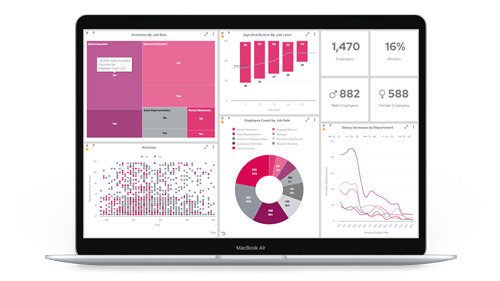
Why This Matters for Anyone Building Dashboard
It is easy to dismiss this as a tech industry hiccup. But if an organisation with OpenAI’s resources can present misleading visuals, the same risk exists in any business creating dashboards without proper governance.
Dashboards are not decorative. They shape decisions at every level, from board strategy to operational priorities. If a chart is wrong, it is not a minor error, it is a strategic misstep waiting to happen. A misplaced axis label, a mis-scaled graph, or an irrelevant KPI can shift focus away from what truly matters.
AI Is Not the Whole Answer
I believe in the potential of AI. At Panintelligence, we use it to surface patterns faster, automate repetitive tasks, and help generate ideas. But AI does not understand your business context. It will not challenge whether a metric is relevant, or whether the visual it has just created contradicts last month’s board pack. Without human oversight, it can deliver outputs that are beautifully designed but fundamentally wrong.
Why Panintelligence Takes a Different Approach
We combine AI assistance with rigorous human governance. That means every KPI is defined in the context of your business goals. Every visual is tested for accuracy, consistency, and relevance. Every dashboard is built to tell the truth, not just look good.
The GPT-5 launch was a public reminder of what happens when capability outruns control. In their case, it was a headline and online debate. In your business, it could be a costly misdirection.
For all the Marketers who need it fast
We all know that sometimes, speed matters, Marketing teams often need to drop a chart into a board pack, pitch or campaign update at short notice. Here is how we make sure you can move quickly without sacrificing accuracy:
- Panintelligence includes a one-click export function that lets you instantly add an accurate, up-to-date chart from your dashboard into a presentation or document.
- You can move fast without hunting through folders or re-requesting reports. The chart you export is the same one your business uses day-to-day, governed, approved, and pulling from live data.
- You save time and avoid mistakes. No outdated visuals. No inconsistent numbers. No risk of showing the wrong chart in front of a stakeholder. Every time you present, you know your visuals are accurate, current, and ready to make the right impression.
If you rely on dashboards to guide your decisions, you need to be able to trust them completely. That is why our clients come to us.
If you want to see what AI-assisted, human-governed dashboards look like in practice, explore our case studies and then book a demo. I will show you how we make sure your dashboards tell the right story, every time.