


Key takeaways
- The role of financial analytics in enhancing decision-making and providing a competitive edge.
- How financial analytics improves operational efficiency and supports strategic planning.
- The importance of leveraging advanced tools and building a data-driven culture for maximizing financial analytics.
Financial analytics is an essential tool for companies aiming to maintain a competitive edge. By leveraging data insights, businesses can make more informed decisions, enhance operational efficiency, and improve strategic planning.
Below, we explore financial analytics, discussing its significance, applications, and the advantages it offers to organizations.
What is financial analytics?
Simply put, it involves using data, statistical methods, and advanced technology to analyze a company's financial information and gain insights into its performance. This process includes collecting, organizing, and evaluating financial data to support better decision-making and strategic planning.
The strength of financial analytics lies in its ability to provide a comprehensive view of a company's financial health, enabling businesses to make informed decisions and maintain a competitive edge.
Benefits of financial analytics
When critical decisions are on the horizon, companies can rely on data-driven insights to steer their choices. Financial analytics plays a key role in several areas, including:
- Profits and losses: It offers a detailed overview of your business's financial health, helping identify profitable ventures and areas that may need improvement.
- Risk management: Financial analytics helps businesses address risks like cash flow challenges and market fluctuations before they escalate into significant problems.
- Future trends: By utilizing predictive analytics, companies can forecast market changes, adjust strategies proactively, and stay competitive by seizing opportunities and avoiding potential risks.
- Operations: A comprehensive view of operational processes allows businesses to pinpoint inefficiencies and focus on areas that need enhancement.
- Regulatory compliance: Real-time tracking and analysis of compliance data ensure organizations can adapt to new regulations quickly and maintain adherence to existing standards.
- Marketing: Financial analytics provides deeper insights into customer behaviors, preferences, and purchasing patterns, enabling more targeted and effective marketing strategies.
Obstacles and constraints in financial analytics
While financial analytics offers many advantages, it also comes with certain challenges:
- Data quality and integration: Incomplete, inconsistent, or siloed data across departments can make it difficult to consolidate and analyze information effectively.
- Cost and complexity of tools: Implementing financial analytics tools often requires significant upfront investment, ongoing maintenance, and updates, which can be resource-intensive.
- Skill gaps: Finding and retaining employees with expertise in advanced analytical techniques and technologies can be both challenging and costly.
- Resistance to change: Cultural reluctance to adopt new technologies and processes can slow the effective implementation of financial analytics.
- Security and privacy concerns: Managing and protecting large volumes of financial data from breaches while ensuring compliance with legal and ethical standards can be complex and demanding.
- Risk of misinterpretation: Even with high-quality data and tools, misinterpretation of insights can lead to flawed decisions with potentially serious consequences.
- Time investment: The process of gathering, cleaning, and analyzing data can be time-consuming, posing a challenge in fast-paced environments that require quick decision-making.
How to use software for financial analysis
Financial analysis software simplifies the process of interpreting complex financial data, making it easier for businesses to gain insights and make informed decisions. Here’s a closer look at how this type of software works and the benefits it provides:
Data collection and integration
Financial analysis software gathers data from various sources, such as accounting systems, spreadsheets, bank accounts, and other financial platforms. By consolidating this information into a centralized location, the software ensures that all relevant data is readily accessible for analysis, saving time and reducing the risk of errors caused by manual data handling.
Data cleaning and preparation
A key function of the software is to clean and standardize data. This involves identifying and eliminating errors, inconsistencies, or duplicates within the data sets. It also ensures that all data is uniformly formatted, which is critical for accurate analysis and seamless integration across systems.
Analytical processing
The software employs advanced analytical techniques to evaluate the data. This includes performing essential calculations like profit margins, return on investment (ROI), and cash flow analysis. It can also handle more complex methods such as regression analysis, time-series forecasting, and variance assessments. These techniques help uncover patterns, trends, and anomalies that might otherwise go unnoticed.
Data visualization
To make insights more accessible, certain software can transform the analyzed data into visual formats such as graphs, charts, and interactive dashboards. These visual tools allow stakeholders to quickly grasp key metrics, spot trends, and compare performance across different periods or business segments.
Reporting and insight generation
The software creates customized financial reports tailored to the needs of specific stakeholders, such as executives, investors, or department heads. These reports highlight critical metrics, performance indicators, and actionable insights, making it easier for businesses to monitor progress and make data-driven decisions.
Forecasting and predictive modeling
Modern financial analysis software often incorporates machine learning and AI algorithms to predict future financial scenarios. This capability enables businesses to anticipate risks, explore "what-if" scenarios, and optimize strategies to achieve their financial goals. For instance, companies can model potential outcomes of investment opportunities or prepare for potential market disruptions.
Supporting strategic decision-making
Ultimately, the goal of financial analysis software is to empower decision-making. By providing comprehensive insights, it enables leaders to evaluate the financial implications of their choices, identify areas for cost savings or investment, and proactively manage risks. This enhances the overall agility and competitiveness of the organization.
With the right financial analysis software, companies can streamline their processes, reduce errors, and unlock deeper insights that drive smarter decisions and sustainable growth.
Types of financial analytics and analysis
Financial analytics involves leveraging processes and technologies to integrate data, conduct analyses, and generate actionable insights. In some cases, it can also automate actions based on those insights. There are four primary types of financial analytics, each addressing different questions:
- Descriptive analytics: Descriptive analytics focuses on understanding "What happened?" or "What is currently happening?" It examines historical data and trends to provide a clear picture of past performance.
- Diagnostic analytics: This type of analysis answers the question, "Why did this happen?" Diagnostic analytics relies on human expertise to form hypotheses about potential causes. It then uses data to identify patterns, relationships, or anomalies that help explain specific outcomes.
- Predictive analytics: Predictive analytics focuses on "What is likely to happen?" By applying statistical models and machine learning algorithms to historical and current data, it identifies trends, forecasts future outcomes, and estimates probabilities.
- Prescriptive analytics: Prescriptive analytics answers the critical question, "What actions should we take?" By using advanced techniques such as machine learning and optimization algorithms, this type of analytics not only evaluates data but also recommends optimal strategies or courses of action.
Financial analysis complements financial analytics by offering a structured way to assess past performance, understand current conditions, and anticipate future outcomes. It uses various types of analytics to provide insights tailored to specific business needs. For instance, predictive analytics might forecast future sales, while diagnostic analytics can help pinpoint the causes of declining profitability.
Examples of Financial Analysis
Financial analysis is applied in numerous areas to support business growth and decision-making, including:
- Assessing profitability: Evaluating the profitability of individual products, services, or customer segments.
- Identifying value drivers: Recognizing and analyzing key factors contributing to the organization’s success and long-term value.
- Forecasting: Predicting future sales, cash flow, or market trends to guide strategic planning.
- Measuring shareholder value: Assessing the value created for shareholders through performance metrics and ratios.
- Using financial ratios: Analyzing financial ratios such as current ratio, quick ratio, liquidity ratio, debt ratio, and return on equity to assess financial health and operational efficiency.
By combining these analytics and analysis techniques, businesses gain a comprehensive understanding of their financial landscape, empowering them to make informed decisions and drive sustained success.
Financial analytics software examples
Financial analytics tools are crucial in enhancing decision-making and operational efficiency. These tools offer a range of features that enable businesses to gain insights into their financial performance and optimize their operations. Some examples of these tools are as follows:
Panintelligence
Okay, we're biased here, but that's because we genuinely believe that our tool delivers real value.
- What makes Panintelligence special?
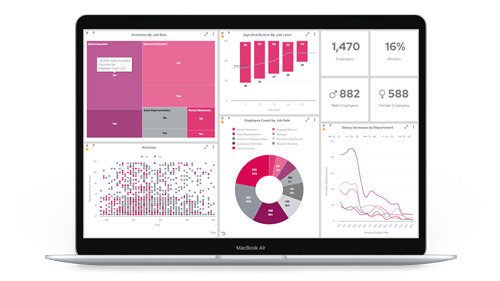
At its core, Panintelligence is designed to make data analytics accessible for everyone—not just the IT pros or data scientists. With our no-code/low-code approach, you don’t need a tech wizard to unlock powerful insights. You can simply dive in and start exploring your financial data right away. - Interactive dashboards tailored to you
Why settle for one-size-fits-all when you can create dashboards as unique as your business? Panintelligence allows users to build fully customizable, interactive dashboards that make financial data easy to visualize and understand. Want to track cash flow trends, measure profitability, or monitor KPIs? It’s all right there, at a glance. - Self-service analytics
Forget long waits for IT or BI teams to generate reports. With Panintelligence, anyone can analyze data independently. The user-friendly interface makes it easy to explore, compare, and interpret financial information without writing a single line of code. - Security first
We understand how critical data security is, especially for financial information. Panintelligence prioritizes secure data handling, so you can rest assured that your sensitive financial data stays protected.
Use Cases:
- Spotting trends in sales performance.
- Tracking key financial indicators, such as profit margins and cash flow, in real-time.
- Empowering departments to make data-driven decisions without technical bottlenecks.
Oracle Essbase
Oracle Essbase (formerly Hyperion Essbase) is a powerful tool focused on enterprise performance management and advanced reporting.
Key features:
- Multidimensional data modeling for deep scenario analysis.
- Advanced planning, budgeting, and forecasting tools to support long-term strategy.
- Integration with other Oracle solutions enhances its utility for large enterprises.
Limitations:
- Designed primarily for reporting, it may lack the flexibility of self-service analytics tools like Panintelligence.
Use cases:
- Scenario modeling for "what-if" analyses in corporate finance.
- Creating detailed budget variance reports to monitor organizational spending.
NetSuite
NetSuite is a cloud-based ERP system that combines financial management with customer relationship management (CRM) and eCommerce capabilities.
Key features:
- Real-time data management ensures that reports and dashboards reflect current financial positions.
- Role-specific dashboards and customizable fields for tailored reporting.
- Scalability to meet the needs of growing businesses, particularly in mid-sized and larger organizations.
Use cases:
- Automating financial processes such as accounts payable and receivable.
- Integrating eCommerce data to provide a unified view of financial and operational performance.
- Enabling remote teams to access real-time financial information via the cloud.
Conclusion
Financial analytics is a powerful tool that can transform businesses by enhancing decision-making, improving operational efficiency, and providing a competitive advantage. By leveraging data-driven insights, businesses can optimize their operations, enhance their strategic planning, and gain a competitive edge in the market. As the business landscape evolves, financial analytics will play an increasingly important role in helping organizations navigate challenges and succeed.