Organise your data access (get your ETL on!)
Most companies we speak to are under-utilising their data; we find much of their data is sitting almost redundantly in a database, not being used, or not being farmed properly. So the first problem we tend to see with companies we help, is data access.
What happens in lots of businesses is that potentially useful data ends up in multiple places; people are each using different tools, they create their own places to store their data and they end up with many, many data silos. These could be spreadsheets or little databases, data stored within the individual tool itself, or often stored locally. And this means that no one person has an easy way of accessing and using that data. This creates additional problems: security, and excess cost. Because often data gets replicated over and over again. For example if you consider the data that you have on a prospect, it might end up in four databases on ten people’s machines. And that's where that one version of the truth gets muddied, because people have created their own their own ways of interpreting and getting the data which means that the business as a whole doesn’t have a very good perspective on what's really happening within their organisation.
So, often the first step in getting true value from your data is organising it; we recommend using ELT data tools (Extact, Learn, Transform) to help with this stage – take a look at our recommended best ETL tools.

Quick wins: where do businesses see value of using embedded analytics tools first?
Most BI tools are still used by ‘BI people’ because they're still very technical. Power BI, Tableau, Looker etc, these enterprise BI tools still technically require a lot of skill. So, when we help a company set up embedded analytics tools, the first piece of value they often see is a rapid reduction in time spent working on data-related processes. For example, they are able to quickly cut the time they were spending on producing Excel reports, merging data, pulling different streams together and sending out summaries. The immediate value to the business is enabling pretty much anyone in the organisation to share data-related content quickly and publish dashboards and reports to large numbers of users very easily.

Which industry sectors have been winning by adopting BI tooling in the last 5 years?
We've seen a huge adoption of embedded analytics tooling in retail and marketing. Marketers have accelerated their move to cloud before a lot of other departments and organisations mainly because a lot of marketing has moved to digital. So using things like social media and email marketing, the digitalization of marketing and marketing channels has resulted in an explosion of SaaS platforms. All of these produce valuable data hence why this sector has be one of the fastest to take advantage of BI tools.
Which industry sectors have the most potential to gain from adopting embedded analytics tools?
Traditional manufacturing is a sector that is typically lagging in the use of BI and embedded analytics tooling – meaning this is where a large opportunity exists. Typically you have a manufacturing plant and machinery where the focus is on their physical assets and physical materials. Currently, data isn't at the centre for many of those organisations. We often see lots of systems which are disconnected. For example, we see people who want to extract some data from a particular machine but still have to attend those machines to collect or remove data manually. But because of this, there's a huge opportunity in manufacturing because they're all process driven, and they're all looking for gains through automation. Increasingly, this manufacturing sector is seeing the value of data, and we’re seeing data being used for things like understanding wastage, environmental footprint and improved efficiencies.

How can embedded analytic tools help manufacturers?
We have been working with various manufacturing companies to help then use their data to save money. An example of this is a manufacturer who was using very big, multimillion pound robotic devices on production lines for injection moulding panels for cars. They had an issue where these big machines would sometimes break down, and they would have to call an engineer over from Germany where these robots were built, which would cost thousands of pounds as well as cause a lot of downtime on the production line to fix this specific piece of equipment. This also had a knock-on effect of a huge cost in late production.
We worked with the manufacturer to use their data to identify the trigger as to when the machine was likely to fail so that they could pre-empt bringing an engineer out to reduce their production down time. But we actually enabled them to do more than that; by using that data from these machines we were able to identify what was causing the machine to fail, and therefore take preventative action so that it didn't fail. Additionally we were able to help them use their data to reduce wastage because we could identify faults in parts earlier on in the manufacturing process. So – what we see when a company starts getting serious about using their data, is that there are numerous benefits, some of which go beyond what is initially expected.
What other unexpected discoveries might companies make after properly analysing their data?
We have seen many examples of unexpected value being delivered, after adopting embedded analytics tools. We worked with a legal firm, which are traditional in the sense they tend to be less digitised and data was often on documentation and not necessarily in physical systems. But with new case management systems being applied to track elements such as workload, billing, time recording, etc – there was an increase in the amount of data available. This enabled them to make better decisions around who should be working on that case in order to get the best outcome.
We also worked with the firm to use data to create a scorecard for incoming cases and perform a triage to then determine the best people in the organisation to work on that case to create an effective outcome. This was an unexpected benefit of being able to use that data that they hadn't necessarily perceived. So we love to help organisations that are perhaps not being traditionally data driven, in seeing the value of being data driven, and how that can really help them drive demonstrable performance outcomes. Often we start a journey with data with a specific outcome in mind, but end up having a positive impact on multiple outcomes.

Why making your data visible boosts performance
Visibility of data helps you to improve data quality by ensuring those best placed to validate it can see it. Visibility of data also helps people to realise the importance of making sure it's right. So whether it’s big screens around the office, or a portal that they access every day, or perhaps an app that they use all the time, it’s vital that your team can see with their own eyes the direct correlation between the work they’re doing and the impact on your key metrics. If people don’t have easy and fast access to data, they tend to go back to their default position of making decisions based on gut feelings or what other people sort of advise them on as opposed to using data.

Panintelligence eats its own Pi; How we use embedded analytics ourselves to improve and grow our own business
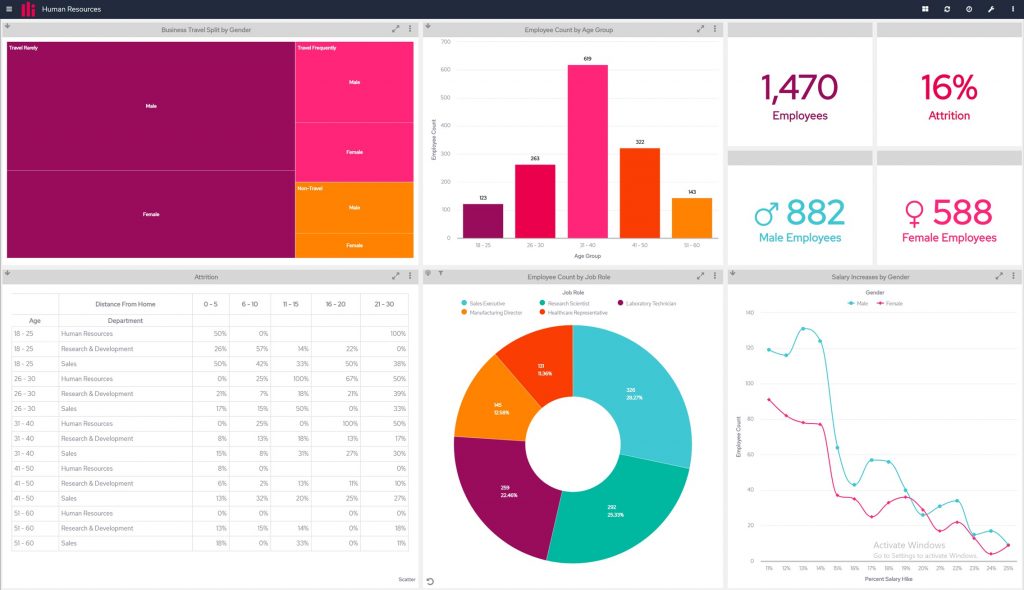
Like many small businesses, we have a great deal of data sources. We have at least 15 different applications that we use, each of which are crucial to running the business and each of which produces data, for example Salesforce, Zendesk, JIRA, Pardot etc. We need to pull all that data together and make sense of it so we have a universal view of our customers our workload and results, across all departments. So using our own embedded analytics tooling, we are able to create a view of everything, from finance, to licencing, to support, to development, to consultancy, all within a single area. We blend all that data together and produce dashboards, which everyone can see on screens around the office (when they are there) or, because our tools are browser based, they can be accessed from anywhere. Our teams are looking at them daily; the visibility and transparency helps with motivation and helps us all feel like we're together as a team. So yes, we do ‘eat our own Pi’ although we prefer to say we drink our own champagne – as the quality of insights our embedded analytic tooling allows us to make, is a top shelf product!
Want to turn your own data into dime? Book a free demo with our embedded analytics tools here.


