


What is descriptive analytics?
Descriptive analytics is the process of analyzing historical data to identify patterns and trends. It provides a clear picture of what has happened in the past within a business or organization. By summarizing large datasets, descriptive analytics helps stakeholders make sense of their data and understand the underlying patterns.
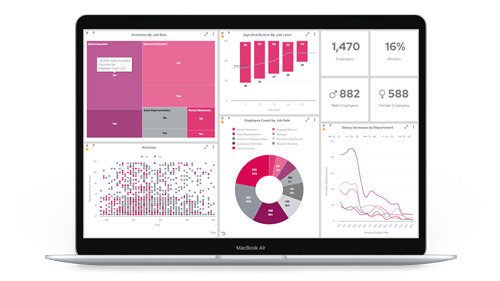
In practice, descriptive analytics involves the use of various statistical techniques and data visualization tools. These tools can include charts, graphs, and dashboards that present data in an easily digestible format. The goal is to provide insights that can inform decision-making and strategic planning.
How does descriptive analytics work?
Descriptive analytics works by collecting and processing historical data from various sources. This data is then cleaned and organized to ensure accuracy and consistency. Once the data is prepared, analysts use statistical methods to identify patterns and trends.
Common techniques used in descriptive analytics include mean, median, mode, and standard deviation calculations. Data visualization tools, such as bar charts, line graphs, and pie charts, are also employed to present the findings in a visually appealing manner. These visualizations help stakeholders quickly grasp the key insights and make informed decisions.
Pros of descriptive analytics
- Provide a historical context for your business information and understand how products and customers relate to each other
- Identify performance gaps and start to build a base for how to improve your processes
- Report on return on investment (ROI) through showing any key metrics that have been achieved
Cons of descriptive analytics
- The most basic form of advanced data analytics will only provide a limited viewpoint
- Further work must be done to get to the heart of how gathered data can be put to good use
- Domain experts input will be needed to understand variables not included in the data set.
Applications of descriptive analytics
Descriptive analytics has a wide range of applications across various industries. In healthcare, it can be used to analyze patient data and identify trends in disease prevalence. In finance, descriptive analytics helps in understanding market trends and assessing investment performance.
Other applications include customer segmentation in marketing, performance analysis in sports, and operational efficiency in manufacturing. By leveraging descriptive analytics, organizations can gain valuable insights that inform their strategic decisions and improve their overall performance.

What is predictive analytics?
Predictive analytics goes a step further than descriptive analytics by using historical data to forecast future outcomes. It employs advanced statistical techniques, machine learning algorithms, and data mining to predict future trends and behaviors. The primary goal of predictive analytics is to provide actionable insights that can help organizations anticipate and prepare for future events.
For example, in the retail industry, predictive analytics can be used to forecast customer demand, optimize inventory levels, and personalize marketing campaigns. By leveraging predictive analytics, businesses can make proactive decisions that enhance their operational efficiency and competitive advantage.
How does predictive analytics work?
Predictive analytics involves several key steps, starting with data collection and preparation. This data is then analyzed using various statistical and machine learning techniques to identify patterns and relationships. The next step is to build predictive models that can forecast future outcomes based on the identified patterns.
These models are continuously refined and validated to ensure their accuracy and reliability. Once the models are in place, they can be used to generate predictions and provide actionable insights. For instance, a predictive model might forecast future sales based on historical sales data, seasonal trends, and other relevant factors.
Pros of predictive analytics
- It’s a highly scalable data model solution that can be understood by everyone in a business
- Predictive analytics is compatible with a self-service structure and machine learning can be used to develop new insights
- It’s a versatile data analytics model that can be applied across multiple industries such as eCommerce, healthcare and finance
- Decision-making can be automated to improve internal processes and reduce the need for human involvement
Cons of predictive analytics
- The probability-based approach means the methodology will never be 100% accurate
- Customer behaviour is always changing, and the model may not always be able to provide fast updates
Applications of predictive analytics
Predictive analytics is also widely used across different sectors. In the healthcare industry, it can predict patient outcomes and optimize treatment plans. In retail, predictive analytics helps in demand forecasting, inventory management, and personalized marketing.
In the financial sector, predictive models are used for credit scoring, fraud detection, and risk management. Additionally, predictive analytics plays a crucial role in supply chain optimization, customer relationship management, and human resource planning. These applications demonstrate the transformative potential of predictive analytics in driving business success.
What is the difference between descriptive and predictive analytics?
The primary difference between descriptive and predictive analytics lies in their objectives. Descriptive analytics aims to provide a clear understanding of past events, while predictive analytics seeks to forecast future outcomes. This distinction is crucial for organizations looking to leverage data insights effectively.
Another key difference is the techniques and tools used in each type of analytics. Descriptive analytics relies on statistical methods and data visualization tools to summarize historical data. In contrast, predictive analytics employs advanced statistical techniques, machine learning algorithms, and data mining to generate forecasts. Understanding these differences can help organizations choose the right approach for their specific needs.
In summary
Both descriptive and predictive analytics play a crucial role in helping organizations make informed decisions. While descriptive analytics provides insights into past events, predictive analytics offers a glimpse into the future. By understanding the differences and relationships between these two approaches, organizations can leverage their data more effectively and drive business success.
At Panintelligence, we specialize in providing embedded analytics and business intelligence solutions tailored for SaaS applications. Our platform is designed to enhance SaaS products by integrating analytics directly into them, allowing companies to leverage data insights more effectively. By following best practices and addressing implementation challenges, organizations can unlock the full potential of their data and achieve their strategic objectives. Request a demo here to find out more.